With property prices falling stagnation could be baked in
Australia's household wealth just grew 1.2% — but strip out property and every other asset was a net drag. What happens when the one engine stalls?

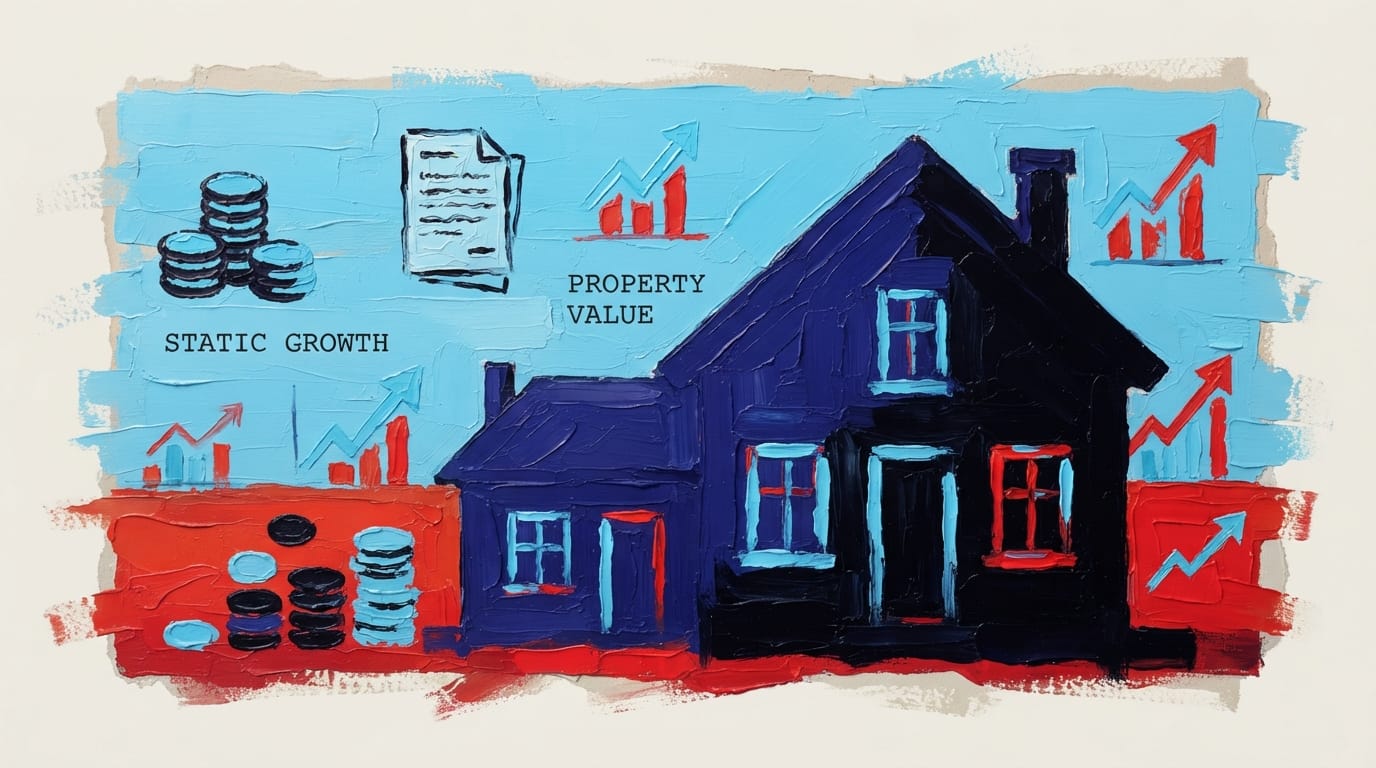
Australian households got a little richer last quarter, but the numbers reveal something more unsettling than comfort. Total household wealth rose by 1.2 per cent in the March quarter 2026, adding $224.9 billion to the national balance sheet. The entire story, though, was residential property: land and dwellings grew 2.5 per cent, contributing $302 billion, or 1.6 percentage points, to wealth growth. Superannuation fell $72.9 billion. Shares barely moved. Deposits ticked up modestly. Strip out the house price gains and aggregate household wealth would have gone backwards.
Property grew by more than total wealth — every other asset was a net drag
The ABS data is stark on this point. Over the past decade, the historical record shows that quarters in which residential property contributed strongly to wealth growth were the good quarters. When property sagged, total wealth often followed. The correlation is not incidental. Residential land and dwellings are by far the largest component of household balance sheets, and when that component stalls, the others rarely compensate. Superannuation is the obvious candidate for a counterweight, but it is volatile, exposed to global equities, and as this quarter demonstrated, susceptible to any deterioration in global risk sentiment. When the Middle East conflict rattled markets early in 2026, super balances lost $72.9 billion in three months.
The geographic dimension of this quarter's result adds another layer. The ABS notes the strongest residential price rises were in Western Australia, the Northern Territory and Queensland. New South Wales and Victoria, home to the bulk of the population and the highest existing prices, saw comparatively modest gains. That means the aggregate 2.5 per cent dwelling price rise is doing less work than it sounds for the largest household populations, while households in the regions now experiencing rapid growth are being dragged into the same affordability dynamics that made Sydney and Melbourne so difficult over the past twenty years.
What this data structure reveals is a wealth model that functions like a single-engine aircraft. While the engine runs, everything is fine.
What this data structure reveals is a wealth model that functions like a single-engine aircraft. While the engine runs, everything is fine. The problem is not that property values grew last quarter. The problem is that they grew by more than total household wealth itself, meaning every other asset class combined was a net drag. That is not a balanced portfolio outcome; it is a structural dependency. And structural dependencies become structural vulnerabilities the moment conditions change.
Australians are borrowing more to hold the same assets
The conditions are already changing in some parts of the country. Property price growth has been uneven and, in some segments, stalling. Mortgage liabilities rose 1.3 per cent or $45.9 billion in the March quarter, trimming wealth growth by a further 0.2 percentage points. Australians are borrowing more to hold the same assets. That leverage amplifies gains when prices rise and amplifies losses when they do not.
The fiscal architecture reliably channels savings into property and rewards it more than alternatives
The policy environment has reinforced rather than corrected this dependency for decades. Negative gearing allows property investors to offset losses against ordinary income, directing investment capital toward established housing rather than productive assets. Capital gains tax discounting for assets held longer than twelve months tilts the advantage further. First home owner grants and buyer subsidies, whatever their stated purpose, have repeatedly capitalised into purchase prices rather than improving affordability, as the pattern from the original First Home Owner Grant through every subsequent iteration has confirmed. Each of these settings individually might be defensible on narrow grounds. Together they constitute a fiscal architecture that reliably channels Australian savings into residential property and rewards it more generously than alternatives.
The 1.2 per cent figure will be received as good news, and for households with property, in a narrow sense, it is. But headline wealth growth that depends entirely on one asset appreciating is not the same as an economy generating broad-based prosperity. It is an economy where, if you already own something, you get wealthier; and if you do not, you fall further behind while watching the numbers go up.
When the engine stutters, there is no second one to switch to. That is the real read in this quarter's data.
Sources
Australian Bureau of Statistics — Land and dwelling values drove a 1.2% growth in household wealth
Frequently Asked Questions
Why did Australian household wealth grow if superannuation fell?
Residential property gains of $302 billion more than offset the $72.9 billion fall in superannuation and the drag from other asset classes. Without property price growth, aggregate household wealth would have declined in the March quarter 2026.
What happens to household wealth in Australia if property prices fall?
Because residential land and dwellings are by far the largest component of Australian household balance sheets, a sustained fall in property prices has no comparable offset. Superannuation is too volatile and globally exposed, and other asset classes have historically not compensated when property stalls.
Why do negative gearing and the capital gains tax discount push money into property?
Negative gearing lets investors offset property losses against ordinary income, while the CGT discount cuts the tax on profits for assets held over twelve months — both benefits applying more readily to established housing than to productive business investment. Together they make property the most tax-advantaged savings vehicle available to most Australian households.
Are first home owner grants making housing more affordable?
The evidence across multiple grant schemes is that buyer subsidies capitalise into purchase prices rather than improving affordability — sellers capture the benefit, not buyers. Each iteration of the First Home Owner Grant has repeated this pattern.
Is Australia's wealth gap between property owners and renters getting worse?
The structural picture suggests yes. Wealth growth is concentrated in an asset class that non-owners cannot access, and the policy settings that channel savings into property have not been unwound. Non-owners are not just missing gains — they are increasingly excluded from the primary mechanism through which most Australians accumulate wealth.